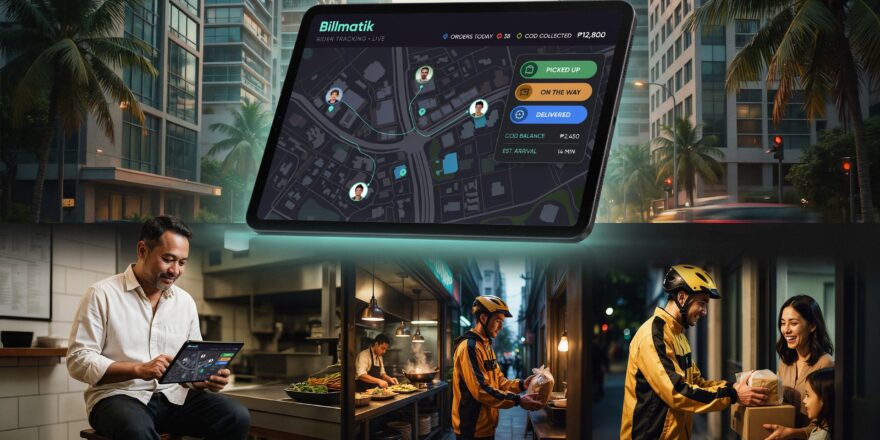

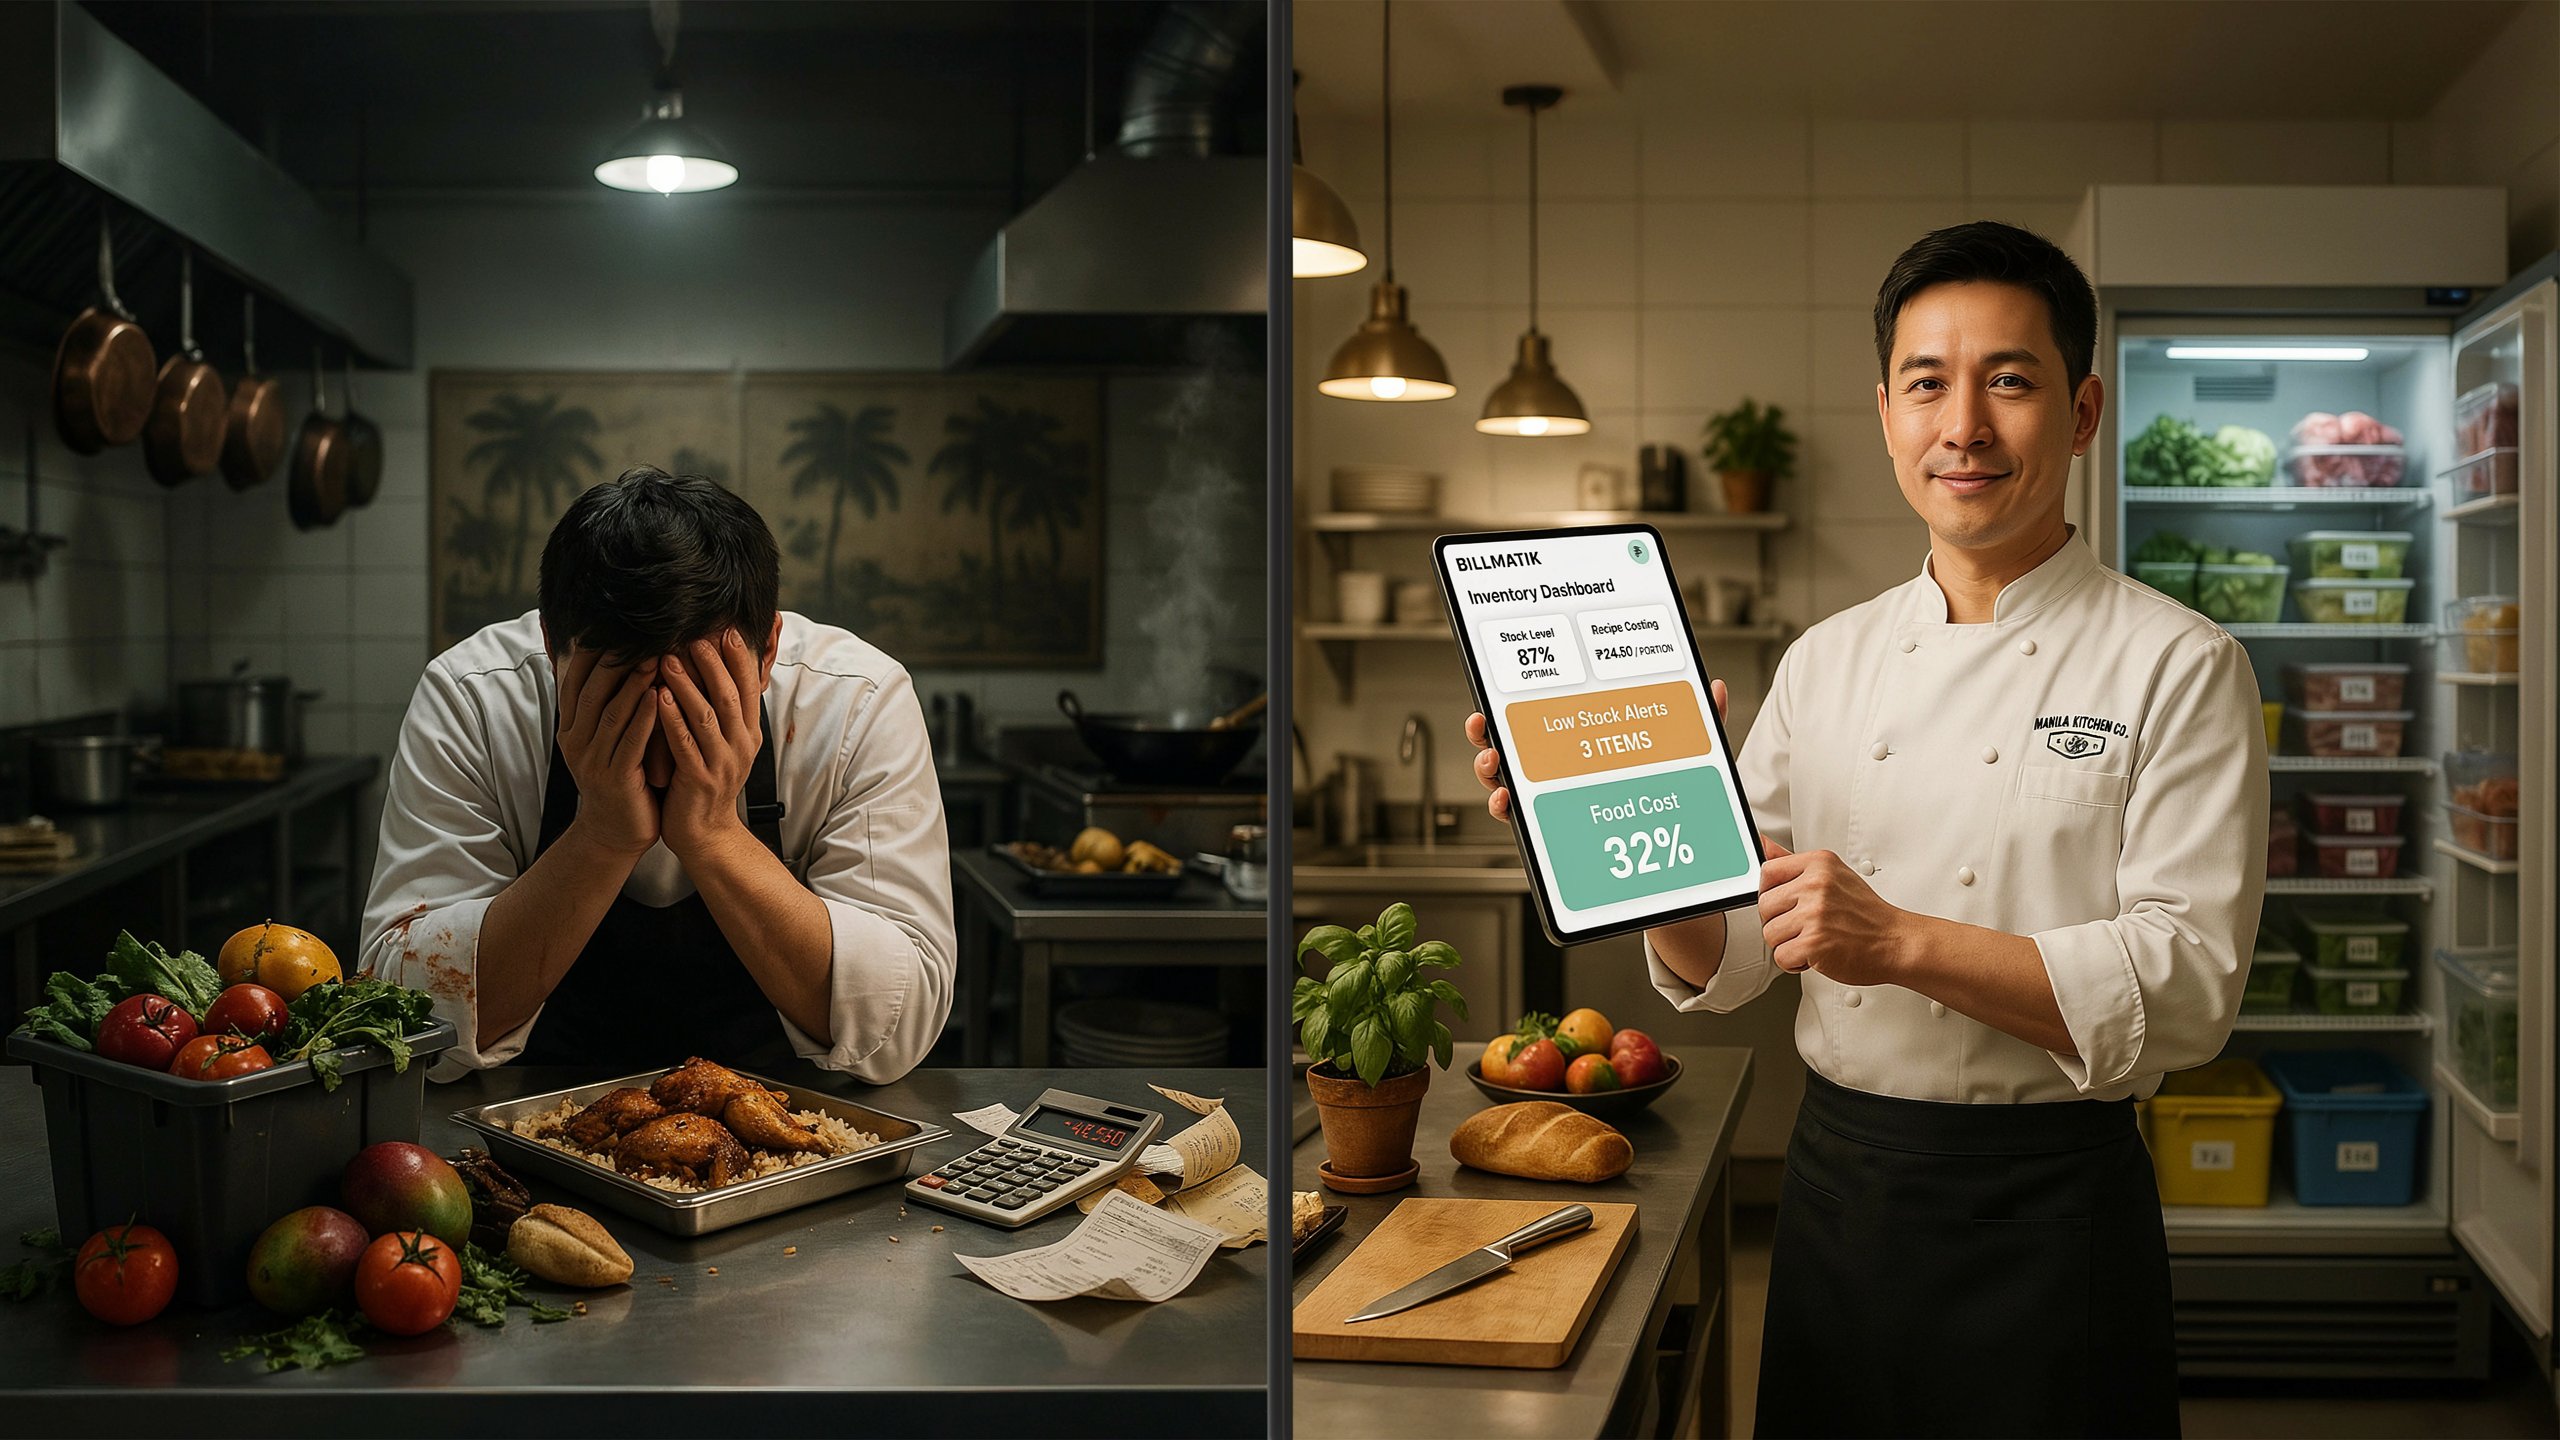
Stop guessing and start growing. These 10 restaurant KPIs reveal exactly how your business is performing — track them weekly to boost profits and cut waste.
The Numbers That Run Your Restaurant
You know the feeling. The dining room is full. The kitchen is firing on all cylinders. Your staff is moving fast. By every instinct, it feels like a good night. Then you check your bank balance at the end of the month and wonder: where did all the money go?
This is the restaurant trap. Busy doesn’t always mean profitable.
Across the restaurant industry, average net profit margins hover around a razor-thin 3–5%. One bad week of overstaffing, one supplier price hike, one month of untracked waste — and that margin disappears entirely.
In that environment, instinct alone is not a strategy. Monthly profit-and-loss statements arrive too late. By the time you see a problem on paper, it has already cost you thousands.
The solution is weekly KPI tracking. Successful operators don’t wait for problems to show up on their P&L — they catch them the day they happen. When you track the right restaurant KPIs every week, you can spot issues early and make immediate adjustments before small problems compound into major losses.
Here are the 10 restaurant KPIs every owner should track weekly — plus exactly how to calculate them and what the numbers should look like.
The 10 Essential Restaurant KPIs
1. Prime Cost Percentage
What It Is: Prime cost is your cost of goods sold (COGS) plus total labor costs, expressed as a percentage of total revenue. It captures your two largest controllable expenses in one number.
Why Track It Weekly: This is the single most important number in your restaurant. If prime cost creeps above 70% for two weeks in a row, something is broken — either you’re over-ordering, labor scheduling is loose, or both. Monthly tracking is too slow; you need to catch this weekly so you can make immediate adjustments.
Formula:
Prime Cost % = (COGS + Total Labor) ÷ Total Sales × 100
Industry Benchmark: 55%–65% for full-service restaurants. Quick-service restaurants may run slightly higher at 60–67%.
What to Do When It’s Off: If prime cost is too high, examine both sides. Is food cost creeping up from waste or portion creep? Is labor cost rising from overstaffing or overtime? Address the root cause immediately — don’t wait.
2. Food Cost Percentage
What It Is: The percentage of your food revenue spent on ingredients. This is where menu strategy quietly wins or loses.
Why Track It Weekly: Food costs typically account for 28–35% of revenue for most restaurant concepts. Small inefficiencies — a few extra grams of protein per portion, spoilage from overordering, vendor price changes — can quickly impact profitability. If your food cost percentage creeps up even one or two points, that’s rarely random.
Formula:
Food Cost % = (Cost of Goods Sold ÷ Food Sales) × 100
Industry Benchmark: 28%–35%. Full-service restaurants often target 28–35%.
What to Do When It’s Off: A rising food cost percentage usually points to something specific: portion creep in the kitchen, vendor price increases, waste from over-prepping, or menu items that are underpriced. Investigate immediately.
3. Labor Cost Percentage
What It Is: Total labor costs (wages, payroll taxes, benefits) divided by total revenue. Labor is typically your largest or second-largest expense.
Why Track It Weekly: Maintaining profitability and making sure you’re scheduling effectively require weekly labor cost percentage tracking. You can make staffing adjustments with a weekly snapshot before overtime depletes your profits. In full-service restaurants, salaries and wages represented a median of 36.5% of sales in 2024.
Formula:
Labor Cost % = (Total Labor Costs ÷ Total Revenue) × 100
Industry Benchmark: 25%–35% for most restaurants. Full-service targets under 30%, quick-service aims closer to 25%.
What to Do When It’s Off: Ask the right questions: Are we overstaffed on slower shifts? Is overtime creeping in? Are managers scheduling based on habit instead of forecasted sales?
4. Average Check Size (Average Ticket)
What It Is: The average amount each customer spends per visit. It’s a reliable gauge of how well your pricing, menu, and upselling tactics are performing.
Why Track It Weekly: Monitoring this every week reveals patterns you might not notice otherwise. For example, your guests may be sharing meals, ordering fewer appetizers, or skipping drinks entirely. A dip in average check often means your servers need refresher training on upselling.
Formula:
Average Check = Total Sales ÷ Number of Transactions (Covers)
What to Do When It’s Off: If average check is declining, review your menu engineering. Are servers suggesting add-ons? Is your pricing competitive? Are you promoting high-margin items effectively?
5. Table Turnover Rate
What It Is: The number of times a table is occupied by new guests during a service period. For most restaurants, the average turnover rate is around three, with guests spending about 50 to 80 minutes dining.
Why Track It Weekly: If you’re a dine-in operation, efficiency = profitability. Tracking average table turn time helps you understand: Are we seating fast enough? Are guests lingering too long? Are we maximizing capacity during peak hours? Improving this number by even a few minutes can lead to more covers per night and higher total sales.
Formula:
Table Turnover Rate = Number of Covers Served ÷ Number of Tables
What to Do When It’s Off: Slow turnover might mean service is lagging, kitchen ticket times are too long, or tables aren’t being cleared quickly enough. Address bottlenecks immediately.
6. Top 5 and Bottom 5 Menu Items by Sales
What It Is: A weekly ranking of your best-selling and worst-selling menu items.
Why Track It Weekly: Your top sellers might be killing your margins — check cost versus price. Your slow movers might be clogging the kitchen, confusing guests, or tying up inventory. This data helps you decide what to promote, remove, or highlight in specials. Over time, you’ll spot patterns that guide smart menu engineering.
How to Track It: Use your POS system to pull this report every Monday morning. Review item-level margin alongside sales data — the 80/20 rule applies: find the 20% of items driving 80% of profit, and feature them.
What to Do With the Data: Promote your high-margin bestsellers. Rethink or remove low-margin items. Consider limited-time offers to test variations of underperformers.
7. Waste Percentage
What It Is: The value of food wasted divided by total food purchases. This includes prep waste, spoilage, and plate returns.
Why Track It Weekly: Food thrown away is money lost. Restaurants waste 4% to 10% of their food purchases on average. Tracking waste weekly lets you spot problems — portion control issues, over-prepping, spoilage — before they compound. Waste tracking and inventory discipline protect COGS and cash flow.
Formula:
Waste % = (Value of Wasted Food ÷ Total Food Purchased) × 100
What to Do When It’s Off: If waste is climbing, examine: Are you over-prepping? Is inventory not being rotated (FIFO)? Are portion sizes inconsistent? Are ingredients spoiling before use?
8. Customer Satisfaction Score (CSAT) or Net Promoter Score (NPS)
What It Is: A measure of how satisfied your guests are with their experience. NPS asks how likely customers are to recommend your restaurant.
Why Track It Weekly: Weekly feedback reveals service gaps, kitchen mistakes, or ambiance issues in real time. A drop in food cost doesn’t help if your guests aren’t coming back. Highly data-driven companies are three times more likely to report significant improvements in decision-making.
Industry Benchmark: CSAT score of 85% or higher. NPS above 50 is considered excellent.
How to Track It: Use automated post-dining surveys (via integrated feedback tools) and review the data weekly with your team. Track review volume and ratings on Google — target 5+ new reviews per month for a growing restaurant.
9. Void and Comp Rates
What It Is: The percentage of transactions that are voided or comped — by server, by hour, by menu item.
Why Track It Weekly: These are leak detectors. Too many voids or discounts may point to training gaps or process problems. A server with a 5%+ void rate when the average is 1% has either a training gap or a theft problem. Real-time POS reporting catches this in days, not on next month’s P&L.
What to Do When It’s Off: Investigate immediately. Is there a training issue? Is a particular staff member voiding more than others? Are certain items being comped frequently? Use the data to tighten controls and refine staff training.
10. Direct vs. Third-Party Order Revenue Split
What It Is: The percentage of your order revenue coming from direct channels (your website, phone, walk-in) versus third-party delivery apps.
Why Track It Weekly: Growing direct share means more profitable revenue. Over-reliance on delivery apps at 25–30% commission is a long-term margin threat. If you offer both dine-in and online options, your POS should show how each channel is performing — this helps you plan targeted marketing, delivery driver scheduling, and dine-in experiences that adapt to customer behavior.
What to Do When It’s Off: If third-party share is growing, invest in driving direct orders. Promote your own ordering website, offer small incentives for direct orders, and build your customer database through loyalty programs.
How to Build Your Weekly KPI Dashboard
Step 1: Choose Your Core KPIs
Most owners need 10-15 core KPIs, not 50. If you track too many, you’ll stop reviewing them. Start with the 10 above and add only what’s essential for your specific concept.
Step 2: Set a Consistent Cadence
- Daily KPIs: Sales vs. forecast, labor hours, voids/comps
- Weekly KPIs: Labor %, food cost %, prime cost, inventory variance
- Monthly KPIs: Menu mix, pricing, vendor performance
Step 3: Build Two Dashboards
Create an Owner Dashboard (higher-level, trend-focused — perfect for a weekly 30-minute review) and a Manager Shift Dashboard (simpler, more immediate, designed for coaching during the week).
Step 4: Assign Owners and Actions
Assign an owner to each KPI (who checks it and takes action). When a KPI is off, don’t just “watch it” — write down one corrective action and a deadline. That’s how KPIs become a tool for improvement instead of a report you forget.
How Billmatik Makes Weekly KPI Tracking Effortless
Tracking all 10 of these KPIs manually is a full-time job. Spreadsheets get outdated. Managers forget to update them. By the time you catch a problem, it’s already cost you money.
Billmatik is the complete restaurant operating system — and built-in analytics and reporting are core features. Everything you need to track these KPIs is in one place:
Real-Time Sales and Revenue Reports
See total weekly sales, revenue breakdowns by category, and sales by time of day — all updated in real time.
Food Cost and Prime Cost Tracking
Auto-deduct stock when orders are placed. Track ingredient-level costs per recipe. See food cost percentage and prime cost automatically calculated.
Labor Cost Monitoring
Track labor cost percentage, hours worked, and overtime — all integrated with your scheduling.
Menu Item Performance
See exactly which items are selling and which aren’t. Pull your Top 5 and Bottom 5 report with one click.
Waste Tracking
Log waste events with categories — prep waste, spoilage, plate returns. Aggregate data to pinpoint trends.
Customer Feedback Integration
Collect and review customer satisfaction data alongside your operational metrics.
Delivery Channel Breakdown
See direct vs. third-party order revenue split. Track which channels are growing and which are costing you margin.
One Dashboard, Complete Visibility
No more disconnected systems. No more spreadsheets. Everything in one place — from sales to labor to inventory to customer satisfaction.
With Billmatik, you’re not just collecting data. You’re getting actionable insights that help you make smarter decisions faster.
Conclusion: Weekly Visibility = Long-Term Control
Restaurant success isn’t just about great food or full dining rooms — it’s about consistently managing the numbers that move the needle. By tracking these 10 KPIs every week, you’ll:
Don’t wait for monthly P&Ls to tell you there’s a problem. By then, the damage is done. Start tracking weekly. Start taking control.
Ready to Take Control of Your Restaurant KPIs?
Join restaurants across Africa, Southeast Asia, and beyond that are using Billmatik to track their KPIs, reduce waste, and boost profits.
🚀 Get Started with Billmatik Today!
- 🌐 Visit: https://billmatik.mentorsucces.com/
- 📊 Real-time KPI dashboards
- 📈 Food cost, labor, and prime cost tracking
- 📱 Menu performance and waste analytics
- ✅ 30-day money-back guarantee
Stop guessing. Start tracking.
restaurant KPIs , restaurant KPIs , restaurant KPIs , restaurant KPIs , restaurant KPIs , restaurant KPIs , restaurant KPIs , restaurant KPIs , restaurant KPIs , restaurant KPIs , restaurant KPIs , restaurant KPIs , restaurant KPIs , restaurant KPIs , restaurant KPIs , restaurant KPIs , restaurant KPIs , restaurant KPIs ,